Problem
Huge Log file sync waits during 3 hour run of ETL job (Extract, transform, Load) on one of the nodes of 2 Node RAC cluster.

2 Node RAC
Block Size: 16K
ClusterWare Version: 11.1.0.7
RDBMS and ASM Version: 11.1.0.7.9
OS : AIX 6.1
Storage Vendor : Oceanstor s2900
Number of LMS processes: 2 per node, running in Real Time priority as expected.
Background
Log file sync wait for Single Instance DB has been explained in depth in many blogs. I will take a moment to extend its definition for RAC and summarize the sequence of events involved in log file sync wait:
1.) User issues commit/rollback(ends with a commit) and wakes up log writer (LGWR). The wait time for log file sync starts here.
2.) LGWR issues/queues write call to OS to write to disk, refreshes the logical scn and asynchronously posts LMS to broadcast this SCN (BOC) from the local instance to other instances in cluster.
While I/O subsystem completes the write to disk, LGWR itself starts waiting on ‘Log File Parallel Write‘.
Wait counter for ‘wait for scn ack‘ also starts ticking now.
3.a) Once write is complete, OS posts back to LGWR. This is where wait counter for log file parallel write stops. For every slow write to disk (log write taking more than 500ms), a warning is written to LGWR tracefile “Warning: log write time 550ms, size 17KB“
3.b) By this time, if local node has not received the SCN acknowledgement for the BOC post sent to remote nodes in step 2, LGWR continues to wait on “wait for scn ack” event. If this wait for scn acknowledgement is more than 500ms, another warning get logged to the lgwr tracefile “Warning: log write broadcast wait time 670ms”
Note: In 11.1 RAC, For a simple commit statement, it is easy to see this otherwise invisible wait event by setting “_lgwr_async_broadcasts”=false and by enabling 10046 trace on LGWR.
11.2 has another interesting parameter “_lgwr_posts_for_pending_bcasts” which is set to False by default. I am yet to test its impact on log file sync waits.
4.) Once acknowledgement is received by LGWR from other instances , LGWR posts back to user that write is complete (commit is durable).
5.) Right after posting back to user session, log file sync wait counter stops.
Its worth noting that with all these steps involved in log file sync waits, CPU scheduling plays a crucial role in almost every step. It is possible that LGWR doesn’t get CPU cycle immediately and has to wait in run-queue. All this wait time would add to the user ‘log file sync’ wait time.
Analysis
Areas to analyze:
a.) Commit Frequency
b.) I/O response time
c.) CPU starvation
d.) Bugs relevant to BOC scheme.
a.) Commit Frequency
b.) I/O response time
c.) CPU starvation
d.) Bugs relevant to BOC scheme.
Commit Frequency
Number of commits were high. Sections from AWR:
I/O Response Time
LGWR tracefile showed some latency in write time:
Redo Logfiles were/are not multiplexed. However, stored on same RAID 5
disk array as Datafiles. A new REDO_DG was created using disks from a
different disk array than datafiles (though this one was also RAID 5)
and redo logfiles from both instances were moved to a new disk array.
Result: Little improvement.

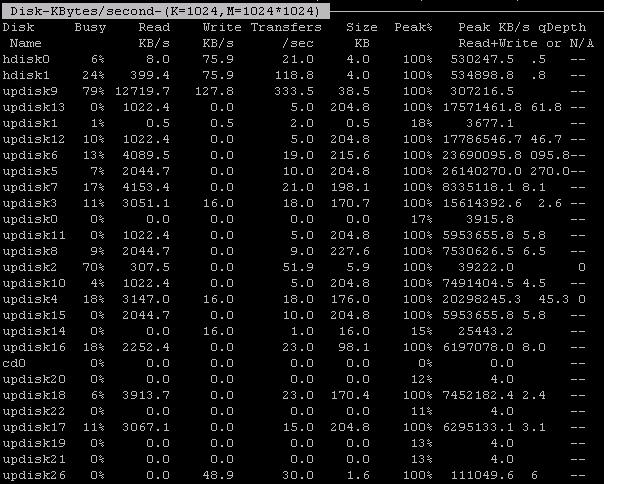
In the snapshot above, updisk26 represents the disk holding the redo logfiles. In this snapshot, Busy% is Zero. However, there were some snapshots taken with busy% around 40 and an occasional 90.
As disk is part of RAID5 array, Parity calculation(even though it happens in background for newer SAN controllers) for every small write to disk might be adding to problems.
CPU Usage
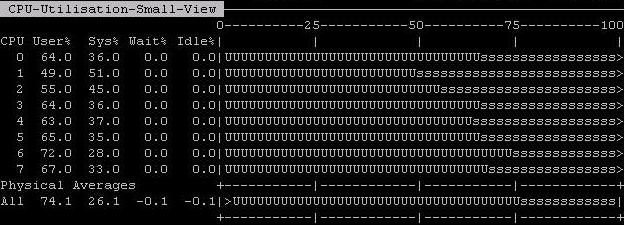
Below is one of the many snapshots taken during the ETL run. Tool used : NMON (AIX)
CPU usage peeked 100%. Reason: An application Module is also running on the DB Host, which is hogging CPU time.

LGWR is not getting enough CPU cycles ?
Bugs relevant to BOC scheme
MOS has a really educative note (ID: 259454.1) explaining different SCN generation Schemes i.e. Lamport SCN Generation and Broadcast on Commit SCN generation Scheme. It also discusses the reason to switch to BOC scheme as default SCN generating Scheme starting 10gR2.
During the ETL job, following messages appeared in lgwr trace, which to me needed more research as to why and how this can impact log file sync waits. Thats how I came up with the fresh write-up for the log file sync wait event for RAC.
Reasons for these waits mostly point to a bug with symptoms of : huge wait time for ‘wait for scn ack’ or lgwr unable to handle multiple posts at the same time.
There are three bugs reported on top of 11.1.0.7 related to log file sync waits & BOC and all of them are worth looking at.
Bug 8490879 – Long “log file sync” latencies due to broadcast on commit scheme
Bug 7716356 – Long “log file sync” latencies with broadcast on commit scheme in RAC
Bug 7610362 – Long “log file sync” waits in RAC with broadcast on commit in RAC
Finally, Options to Consider
a.) Increase number of CPUs on the system. Then, if needed, bump up the priority of LGWR (renice) at OS level. If needed put LGWR in the list of “_high_priority_processes”. LNS and VKTM are already in the list on 11.1
b.) RAID5 is said to provide reasonable sequential write performance, but I am yet to test it. RAID 0 (Striping only) might prove to be a better bet for log files. It is also possible that this I/O subsystem is unable to perform as expected with writes which are smaller than the Stripe size defined for RAID.
c.) Move ETL module of application hosted on the DB Server to a different host.
d.) Reduce the number of commits.
e.) Raise an SR to get a confirmation if problem is due to any known bugs with 11.1.0.7 version.
Number of commits were high. Sections from AWR:
1
2
3
4
5
6
7
8
9
10
11
12
13
14
15
16
17
18
19
20
21
22
23
| Snap Id Snap Time Sessions Curs/Sess --------- ------------------- -------- --------- Begin Snap: 10525 17-Feb-12 02:00:53 118 2.1 End Snap: 10526 17-Feb-12 03:00:04 158 2.7 Elapsed: 59.17 (mins) DB Time: 1,020.28 (mins)Top <del>5</del> 2 Timed Foreground Events~~~~~~~~~~~~~~~~~~~~~~~~~~~~~ Avg wait % DBEvent Waits Time(s) (ms) time Wait Class------------------------------ ------------ ----------- ------ ------ ----------log file sync 12,689,306 36,776 3 60.1 CommitDB CPU 5,164 8.4Statistic Total per Second per Trans-------------------------------- ------------------ -------------- -------------redo size 10,635,966,936 2,995,679.1 799.5user I/O wait time 608,253 171.3 0.1user calls 17,928,502 5,049.7 1.4user commits 12,801,929 3,605.7 1.0user rollbacks 501,433 141.2 0.0 |
LGWR tracefile showed some latency in write time:
1
2
| *** 2012-02-16 02:53:21.691Warning: log write time 550ms, size 17KB |
Here is output from v$event_histogram for log file parallel write
wait, for this db instance (started 3 days before the analysis):
1
2
3
4
5
6
7
8
9
10
11
12
13
14
| EVENT# EVENT WAIT_TIME_MILLI WAIT_COUNT---------- ------------------------ --------------- ---------- 126 log file parallel write 1 59580471 126 log file parallel write 2 3022225 126 log file parallel write 4 1797856 126 log file parallel write 8 624168 126 log file parallel write 16 169960 126 log file parallel write 32 46138 126 log file parallel write 64 18218 126 log file parallel write 128 4825 126 log file parallel write 256 1188 126 log file parallel write 512 353 126 log file parallel write 1024 39 126 log file parallel write 2048 2 |
1
2
| *** 2012-02-18 03:26:35.293Warning: log write time 500ms, size 9KB |

In the snapshot above, updisk26 represents the disk holding the redo logfiles. In this snapshot, Busy% is Zero. However, there were some snapshots taken with busy% around 40 and an occasional 90.
As disk is part of RAID5 array, Parity calculation(even though it happens in background for newer SAN controllers) for every small write to disk might be adding to problems.
CPU Usage
Below is one of the many snapshots taken during the ETL run. Tool used : NMON (AIX)
CPU usage peeked 100%. Reason: An application Module is also running on the DB Host, which is hogging CPU time.

LGWR is not getting enough CPU cycles ?
Bugs relevant to BOC scheme
MOS has a really educative note (ID: 259454.1) explaining different SCN generation Schemes i.e. Lamport SCN Generation and Broadcast on Commit SCN generation Scheme. It also discusses the reason to switch to BOC scheme as default SCN generating Scheme starting 10gR2.
During the ETL job, following messages appeared in lgwr trace, which to me needed more research as to why and how this can impact log file sync waits. Thats how I came up with the fresh write-up for the log file sync wait event for RAC.
1
2
3
4
5
6
7
8
9
| *** 2012-02-17 02:17:33.868Warning: log write broadcast wait time 670ms*** 2012-02-17 22:30:54.316Warning: log write broadcast wait time 3000ms-- RAC Specific waits from AWR ReportStatistic Total per Second per Trans-------------------------------- ------------------ -------------- -------------broadcast on commit wait time(ms) 937,303 264.0 0.1broadcast on commit waits 1,669,140 470.1 0.1 |
There are three bugs reported on top of 11.1.0.7 related to log file sync waits & BOC and all of them are worth looking at.
Bug 8490879 – Long “log file sync” latencies due to broadcast on commit scheme
Bug 7716356 – Long “log file sync” latencies with broadcast on commit scheme in RAC
Bug 7610362 – Long “log file sync” waits in RAC with broadcast on commit in RAC
Finally, Options to Consider
a.) Increase number of CPUs on the system. Then, if needed, bump up the priority of LGWR (renice) at OS level. If needed put LGWR in the list of “_high_priority_processes”. LNS and VKTM are already in the list on 11.1
b.) RAID5 is said to provide reasonable sequential write performance, but I am yet to test it. RAID 0 (Striping only) might prove to be a better bet for log files. It is also possible that this I/O subsystem is unable to perform as expected with writes which are smaller than the Stripe size defined for RAID.
c.) Move ETL module of application hosted on the DB Server to a different host.
d.) Reduce the number of commits.
e.) Raise an SR to get a confirmation if problem is due to any known bugs with 11.1.0.7 version.